Outline of Gender Data Portal
The upcoming gender data portal would expand existing socio-economic statistics with a gender dimension through the addition of new data examining gender aspects of micro-entrepreneurship, education, crime, political empowerment, and representation in the top echelons of the bureaucracy, writes S.K. Ritadhi

S.K. Ritadhi
12 September, 2023 | 4m readThe existing CEDA data portal explores gender statistics from large sample surveys such as quinquennial employment-unemployment surveys undertaken by the National Sample Survey Organisation (NSS), as well as the National Family Health Surveys (NFHS). The former offers information on education and labour market activities across genders, while the latter focuses mostly on health outcomes. In addition to this, data from the Annual Survey of Industries (ASI) provide information on the hiring of women across various (registered) manufacturing industries, as well as differences in industrial wages by gender.
The upcoming gender data portal would expand existing socio-economic statistics with a gender dimension through the addition of new data examining gender aspects of micro-entrepreneurship, education, crime, political empowerment, and representation in the top echelons of the bureaucracy. For instance, we plan on utilising data from the District Information System for Education (DISE) to document regional variations in school enrolment by gender, the availability of female teachers, and infrastructure critical to the well-being of female children, such as separate female toilets in schools, or representation of female parents in school management committees. Similarly, data from the National Crime Records Bureau would assist in capturing regional variations and historical trends in crimes conducted against women. We are unaware of any other data source in India that compiles and disseminates gendered data from nationally representative surveys and administrative sources. CEDA envisages the gender data portal to be useful for both policymakers and practitioners studying the gender landscape in India, ascertaining points of intervention, and assessing progress in women’s empowerment over time.
Gender Aspects of Micro-Entrepreneurship: Some Descriptive Statistics from Informal Enterprises
The NSS’ Survey on Unincorporated Non-Agricultural Enterprises conducted in 2015-16 is a nationally representative survey of unregistered enterprises in India, across all non-farm sectors, except construction.
The survey, by definition, excludes establishments registered under the Factories Act of 1948, or Companies Act of 2013. With a sample of 300,000 micro-enterprises, the survey is representative of 60 million micro-enterprises, providing employment to almost 140 million workers – approximately 30 per cent of India’s labour force. The survey provides rich information on enterprise revenues, value-addition, capital stock, access to credit, usage of raw materials and workers hired. Additional qualitative information on whether the enterprise owner has a bank account uses the internet for operations, faces any problems, or maintains formal accounts is also provided. The survey reports the gender of the enterprise owner, whether the enterprise is located in an urban or rural area, as well as geographic information up to the district.
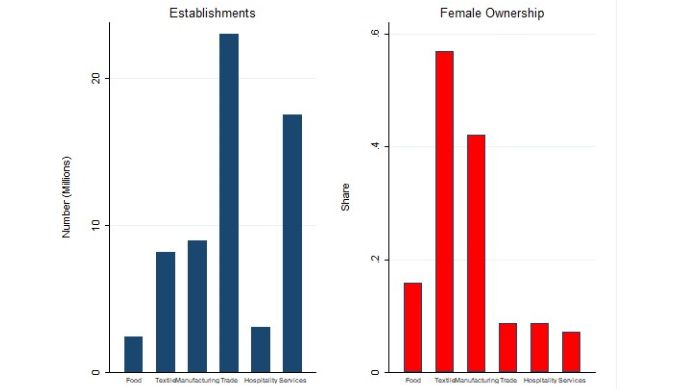
The left panel of Figure 1 shows the number of enterprises across broad sectors, while the right panel shows the fraction of female-owned enterprises by each sector. We disaggregate manufacturing establishments into establishments engaged in the manufacturing of food and beverages; manufacturing of textile and apparel; and other manufacturing establishments. Similarly, service enterprises are split by those providing hospitality services, and other service enterprises. Establishments engaged in wholesale and retail trade account for over a third of the establishments surveyed (in excess of 20 million), followed by service enterprises, enterprises engaged in manufacturing activities, and enterprises manufacturing textiles and apparel. As seen from the right Panel of Figure 1, almost 60 per cent of establishments engaged in the manufacturing of textiles were owned by women, followed by residual manufacturing establishments (40 per cent). Women were least likely to be owning service enterprises (7 per cent).
Figure 2 compares value-addition, revenues, and capital stock for male and female-owned enterprises, across each of our broad sectors. For value-addition and revenues, the top row shows that across all six sectors, female-owned enterprises had lower monthly revenues and value-addition relative to enterprises owned by males. For instance, for enterprises engaged in the manufacturing of textiles and apparel, monthly value-addition for female-owned enterprises was almost a fourth of male-owned enterprises. Similarly, for residual manufacturing operations, monthly value addition for female-owned enterprises is a tenth of that operated by men. Moreover, even male-operated establishments engaged in the manufacture of textiles had lower value-addition than establishments in the remaining sectors. The descriptive evidence suggests that female micro-entrepreneurs operated in industries offering relatively low returns in general, and even in these industries, their returns from manufacturing were significantly lower than male-owned enterprises.
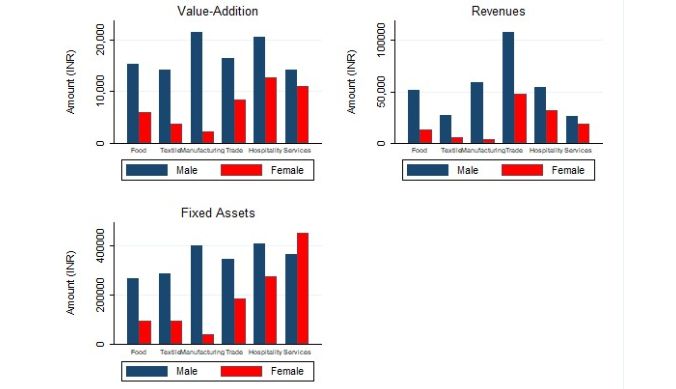
The bottom panel of Figure 2 compares capital stock across male and female-owned micro-enterprises. Capital stock is measured using gross fixed assets, which include the value of land, buildings, plant and machinery, and tools owned by the enterprise. Similar to value-addition and revenues, female-owned enterprises had capital stock an order of magnitude lower than male-owned enterprises. Surprisingly, the only sector in which female-owned enterprises had higher capital stock was services (excluding hospitality). Only 10 per cent of female-owned micro-enterprises however operated in these sectors. The capital stock of female-owned manufacturing establishments, comprising 70 per cent of female-owned micro-enterprises, was less than a fifth in value, relative to male-owned micro-enterprises. The descriptive evidence points to low scale of operations for female-owned establishments, with low value-addition.
(S. K. Ritadhi is an Assistant Professor of Economics at Ashoka University)
Study at Ashoka


